
Market Outlook 01/07/2021
Market Outlook 01/07/2021

/RTY continues to be the leader for directional move in this market. It is however pushing to top of channel and may find some short term resistance at 2080-2085 and 2104-2113 zone
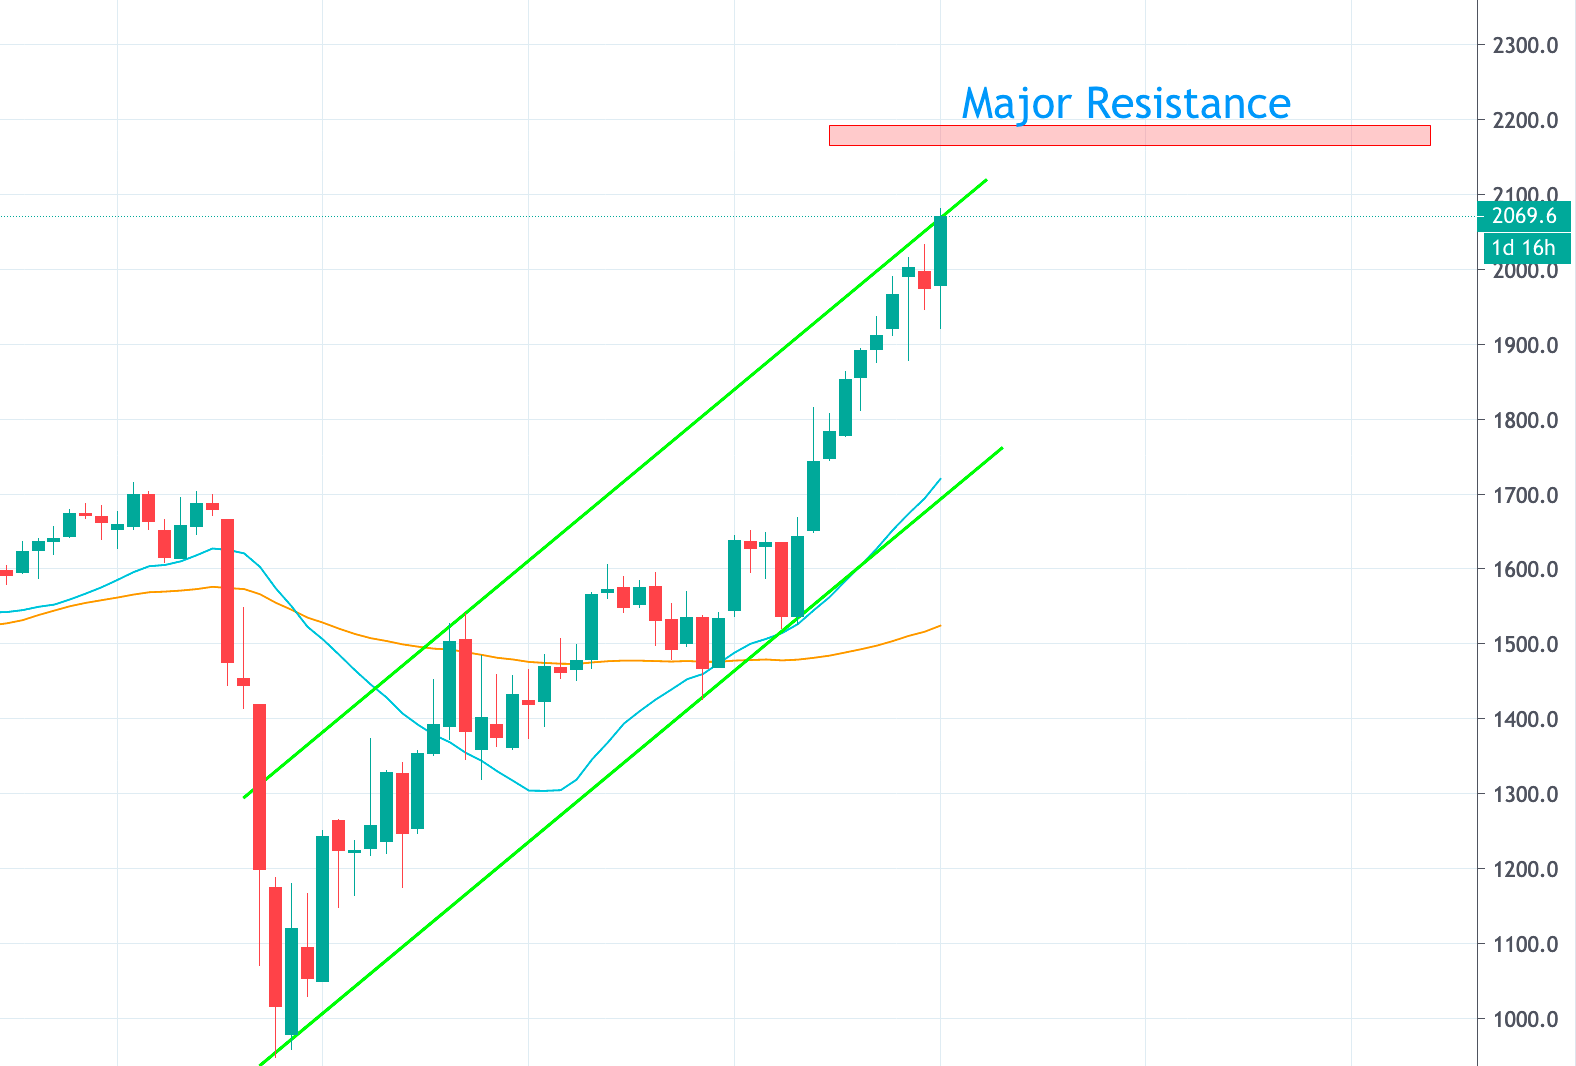
A weekly close outside the channel for /RTY isn’t likely but that doesn’t preclude an intraday rip and reversal by Friday for /RTY. We’ve reached levels to locking in profits on /RTY
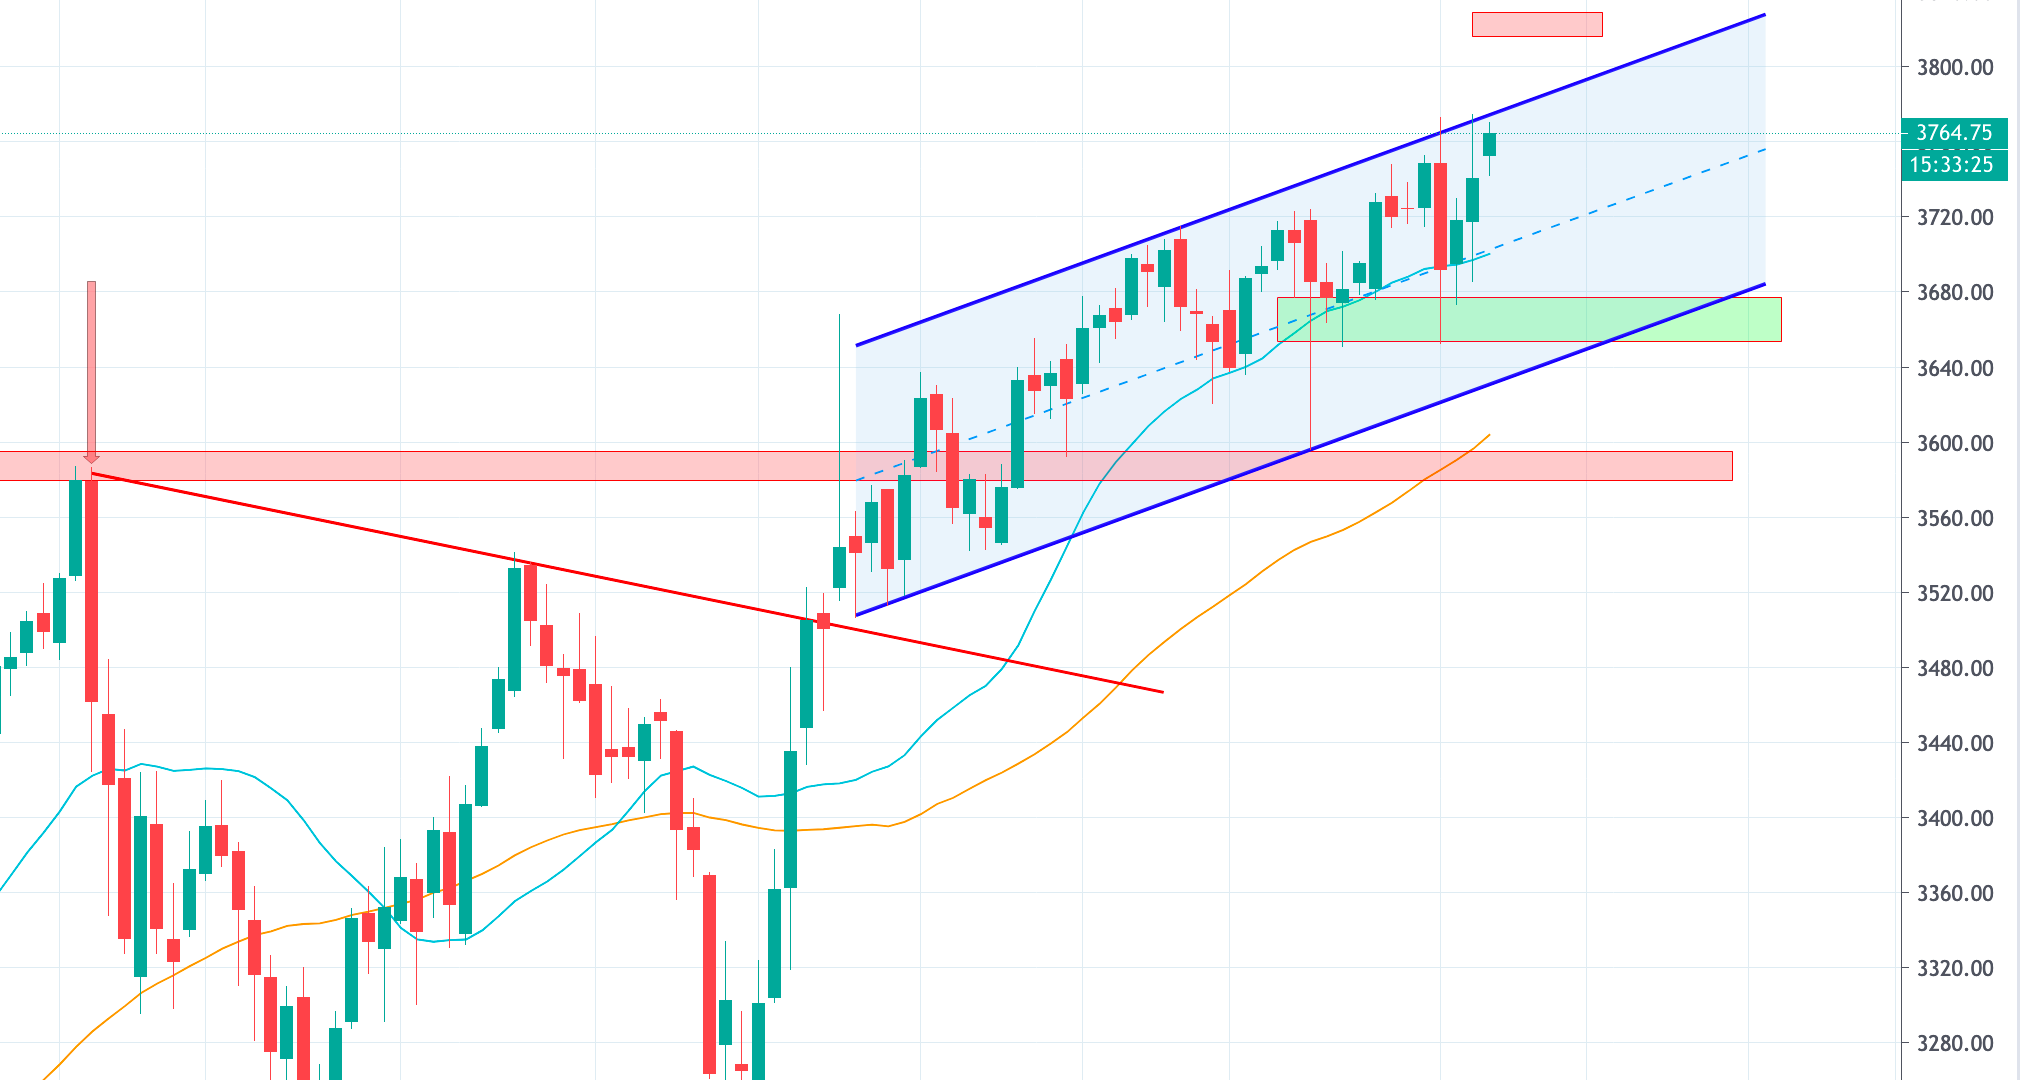
/ES continues to push against the all-time-highs but bears have managed so far to hold the line. Fundamentally, the long-term bullish thesis continues to hold. However, short-term has been pretty wild in 2021 and today marked a reversal in VIX as well which held the mini-breakout levels from Monday
/ES Market Levels
3821-3829 (Top of possible range)
3798-3806 (Target zone on breakout)
3771-3778 (Previous all-time-highs, Current week’s high)
3728-3736 (Line in sand, bullish above, Tuesday highs)
3711-3715 (Minor pullback zone)
3680-88 (Short term support)
3651-62 (Monday’s low and Breakdown target)
3622-34 (Bottom of possible range)
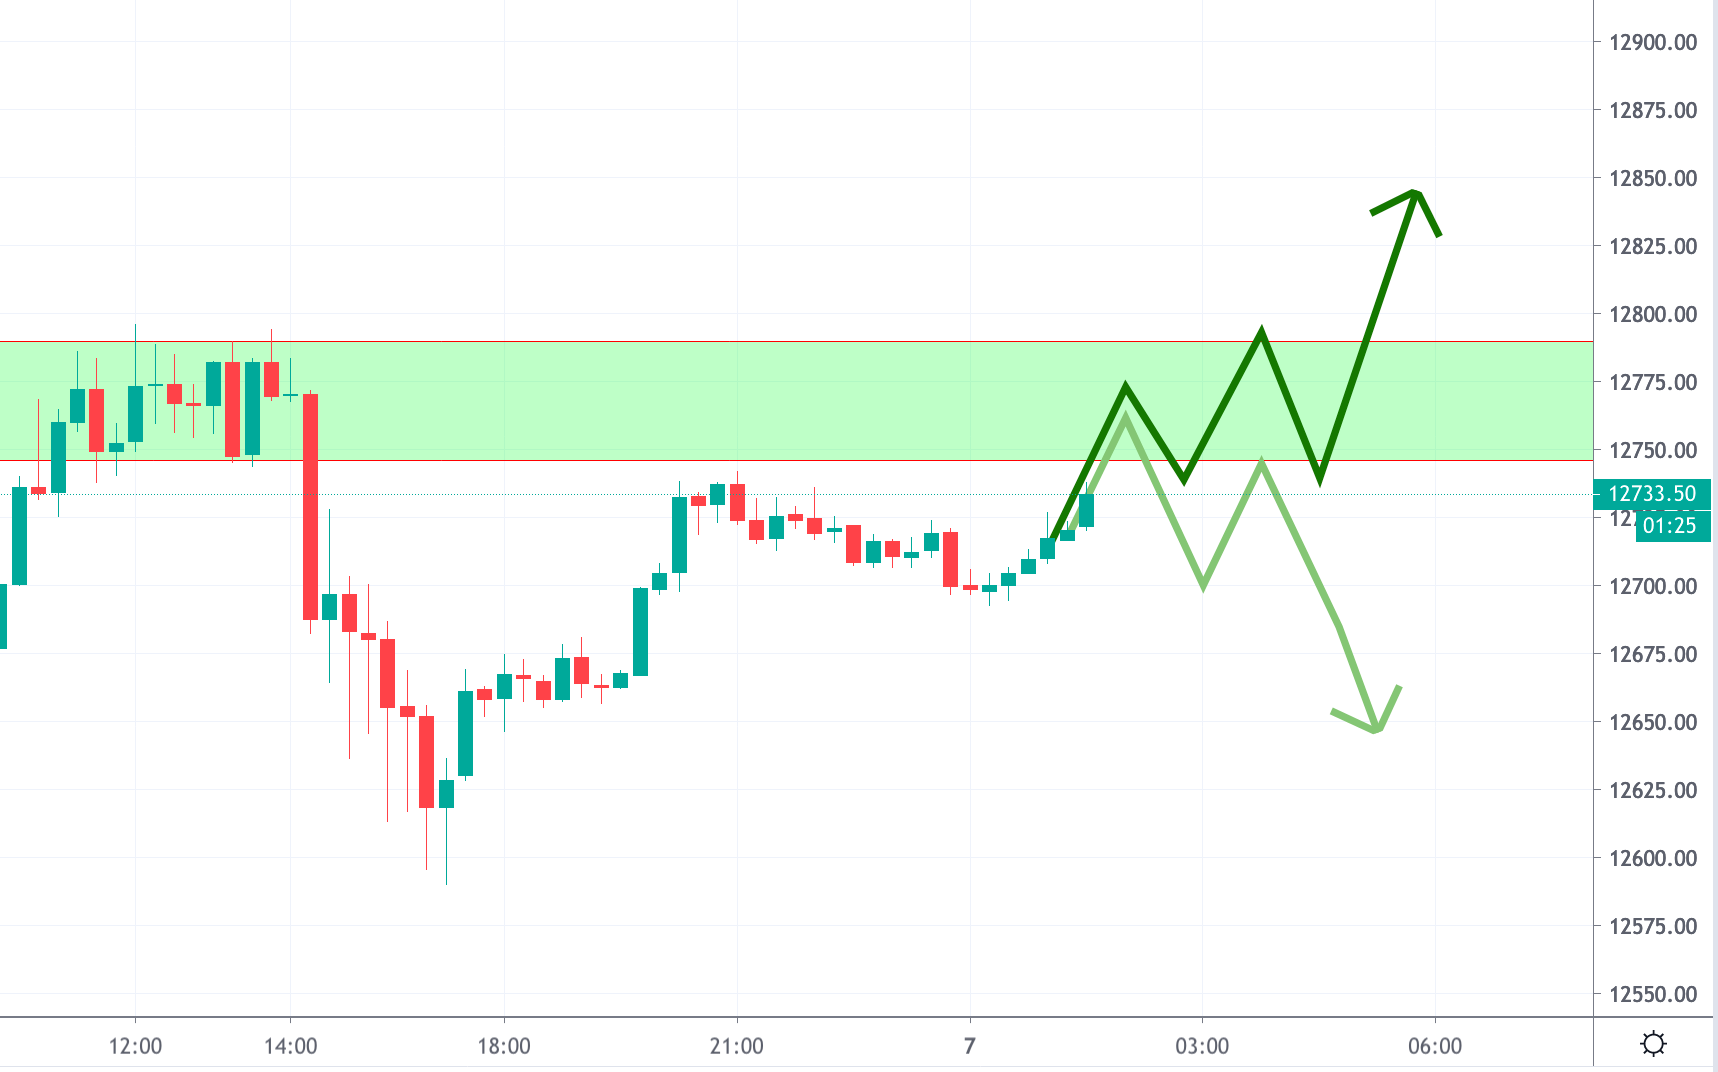
/NQ was the weakest of the major indices today as /ES held relatively well due to monster rally in /RTY.
If /RTY gets stalled at the resistance levels mentioned above, /NQ should present a better buy-the-dip opportunity. However, if /RTY breaks out of resistance, then that strength will be more visible in /ES
/NQ Market Levels
12937-963 (Top of possible range)
12844-872 (First Target zone on breakout)
12792-811 (First Resistance Zone, Wednesday (01/06) highs)
12740-765 (Balance zone. Look for pullbacks in this zone to buy)
125640-670 (Intraday Line in Sand)
12582-602 (Target zone on breakdown)
12480-501 (Short term support)
12404-444 (Major support zone, Bottom of possible range)